

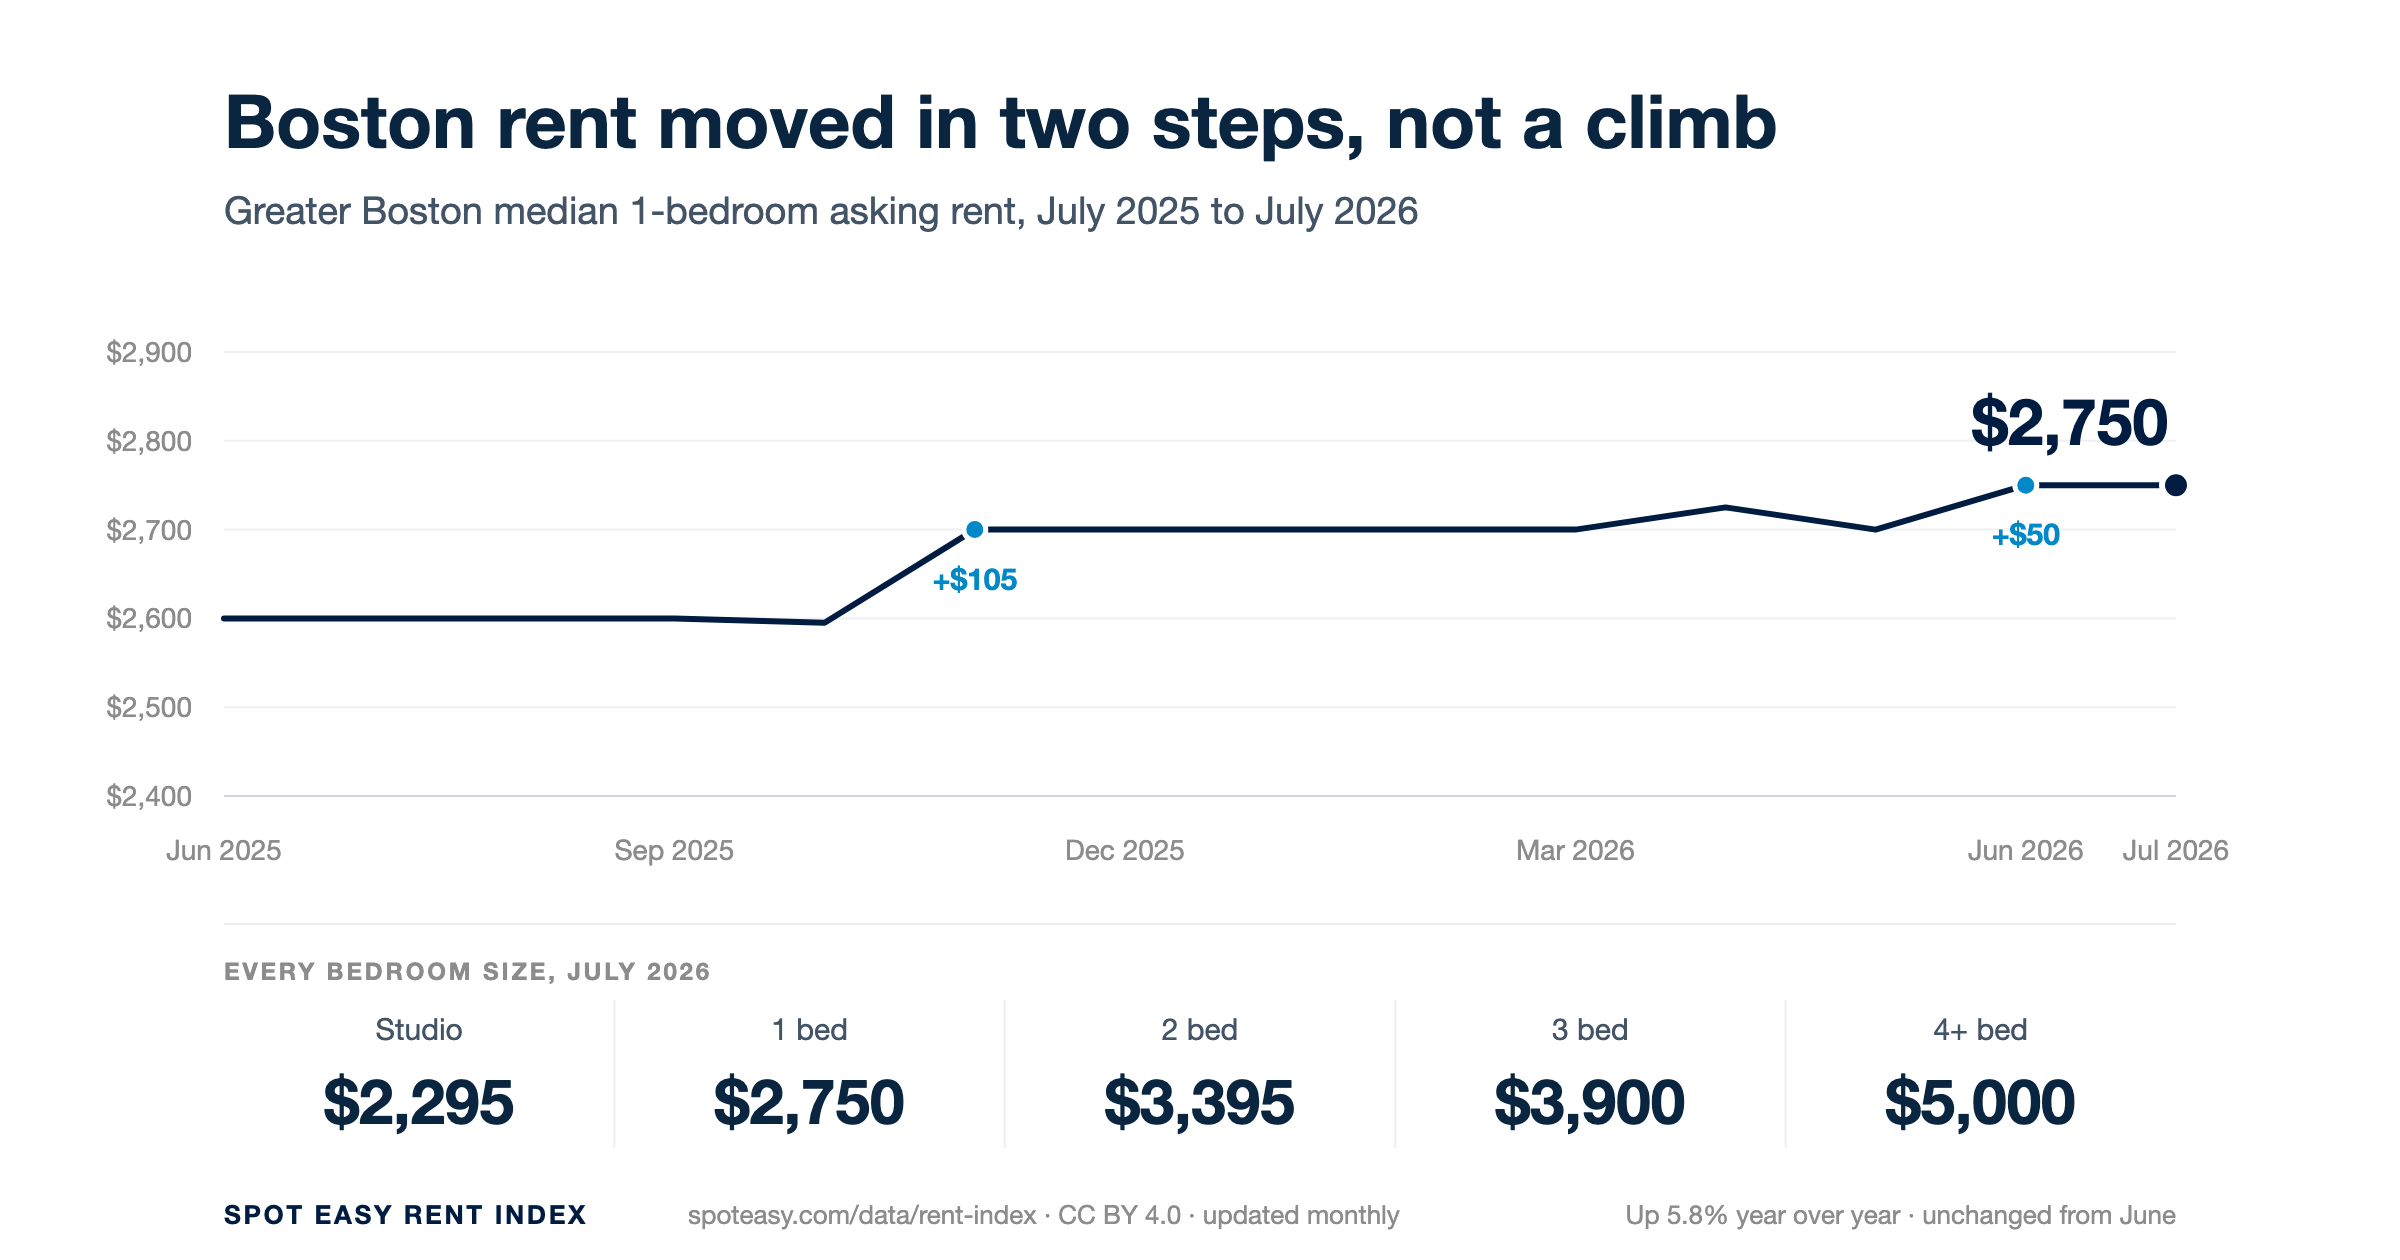
Greater Boston's median one bedroom rent was $2,750 in July 2026, unchanged from June. Studios, two bedrooms and four bedroom apartments all finished the month within $5 of where they started. Only three bedrooms moved at all, down $100.
That is the whole month in a sentence, and it is not what most rent reports are saying right now. Below is every figure behind it, by neighborhood and by bedroom count, taken from apartments actually listed on Spot Easy during July. The full dataset lives on the Spot Easy Rent Index, which we update monthly and publish under a CC BY 4.0 license, so anyone can reuse it with attribution.
What this measures. Every figure here comes from apartments listed on Spot Easy, and every Spot Easy listing comes from a licensed real estate professional or directly from the MLS. We verify agents before their listings go live. Nothing in this dataset was posted anonymously, unlike sites where anyone can post a listing.
It also means this is our inventory, not a census of every apartment in Greater Boston. Nobody has that number. What we can tell you is exactly what we measured, and how.
Did Boston rents go up in July 2026?
No. Greater Boston rents were essentially flat in July 2026. Four of the five bedroom sizes we track moved by $5 or less against June, and the fifth fell.
| Apartment size | July 2026 | June 2026 | Change |
|---|---|---|---|
| Studio | $2,295 | $2,300 | down $5 |
| 1 bedroom | $2,750 | $2,750 | no change |
| 2 bedroom | $3,395 | $3,390 | up $5 |
| 3 bedroom | $3,900 | $4,000 | down $100 |
| 4+ bedroom | $5,000 | $5,000 | no change |
A word on what "median" means here, because it matters for how you read the rest of this page. The median is the middle listing: half of July's apartments asked more, half asked less. It is not an average, so a handful of very expensive units cannot drag it upward. Where we show a typical range, that is the middle half of listings, meaning a quarter asked less than the low figure and a quarter asked more than the high one.
| Apartment size | Median rent | Typical range (middle 50%) |
|---|---|---|
| Studio | $2,295 | $2,025 to $2,500 |
| 1 bedroom | $2,750 | $2,400 to $3,150 |
| 2 bedroom | $3,395 | $2,900 to $3,925 |
| 3 bedroom | $3,900 | $3,375 to $4,650 |
| 4+ bedroom | $5,000 | $4,200 to $6,000 |
Greater Boston rent has moved in two steps since July 2025
The one bedroom median is up $150, or 5.8%, from July 2025. It did not climb there gradually.
Our median sat at $2,600 from June through September 2025, slipped $5 in October, then jumped $105 to $2,700 in November and held exactly there for five straight months. It wobbled $25 either side in the spring and settled at $2,750 in June 2026, where it stayed through July.
Two moves, November 2025 and June 2026, account for essentially the entire year's increase. The other twelve months were flat or nearly so.
That pattern is worth knowing if you are timing a search. Boston rent does not drift upward a little every month. It sits still, then resets, usually when the leasing calendar turns over.
Median rent by Boston neighborhood, July 2026
Cities first. Boston, Cambridge, Somerville and Brookline are reported at city level.
| City | Studio | 1 bed | 2 bed | 3 bed | 4+ bed |
|---|---|---|---|---|---|
| Boston | $2,270 | $2,700 | $3,300 | $3,798 | $4,995 |
| Brookline | $2,313 | $2,995 | $3,600 | $4,500 | $5,900 |
| Cambridge | $2,400 | $2,900 | $3,697 | $4,200 | $5,100 |
| Somerville | $2,318 | $2,600 | $3,100 | $3,750 | $4,700 |
Then neighborhoods. Note that the Boston row above contains the Boston neighborhoods below it, so these columns do not add up to it.
| Neighborhood | Studio | 1 bed | 2 bed | 3 bed | 4+ bed |
|---|---|---|---|---|---|
| Allston | $2,025 | $2,380 | $3,040 | $3,600 | $5,200 |
| Back Bay | $2,500 | $3,150 | $4,300 | $5,500 | not published |
| Beacon Hill | $2,350 | $2,870 | $3,575 | $4,598 | not published |
| Boston Downtown | $2,550 | $3,263 | $5,050 | not published | not published |
| Brighton | $2,050 | $2,400 | $2,900 | $3,600 | $4,600 |
| Brookline Village | not published | not published | $3,500 | not published | not published |
| Charlestown | not published | $3,172 | $3,900 | not published | not published |
| Chestnut Hill | not published | not published | $3,000 | not published | not published |
| Chinatown | not published | $3,405 | $4,928 | not published | not published |
| Coolidge Corner | $2,335 | $3,000 | $3,650 | $4,500 | $5,423 |
| Dorchester | not published | $2,500 | $2,850 | $3,300 | $3,800 |
| East Boston | not published | $2,525 | $3,000 | $3,100 | $3,798 |
| Fenway | $2,375 | $2,800 | $3,800 | $5,100 | $7,200 |
| Hyde Park | not published | not published | $2,700 | not published | not published |
| Jamaica Plain | $1,950 | $2,500 | $3,200 | $3,600 | $4,800 |
| Mission Hill | $2,100 | $2,575 | $3,000 | $4,350 | $6,200 |
| North End | not published | $3,013 | $3,695 | $4,800 | not published |
| Oak Square | not published | not published | $3,000 | $3,500 | $4,600 |
| Roslindale | not published | not published | $2,850 | $3,300 | not published |
| Roxbury | not published | $2,550 | $3,500 | $3,900 | $4,800 |
| Seaport District | not published | $3,373 | not published | not published | not published |
| South Boston | $2,425 | $3,000 | $3,775 | $4,650 | $6,000 |
| South End | $2,300 | $3,025 | $4,000 | $5,000 | not published |
| West Roxbury | not published | not published | $2,850 | not published | not published |
"Not published" is a real answer, not a gap. We only publish a figure when we had at least 20 listings of that size in that area during the month. Below that, one unusual apartment moves the median enough to mislead you, so we say nothing instead of guessing. Roslindale genuinely had no publishable one bedroom figure in July. The Seaport had only a one bedroom. That is what our listings looked like in July, and we would rather show you the hole than fill it in.
Cheapest one bedroom on the board is Allston at $2,380. The most expensive is Boston Downtown at $3,263. That is a spread of under $900 a month between the cheapest and priciest one bedroom neighborhoods we publish, which is smaller than most renters expect.
Where rents moved most since last July
Twenty four areas have a July 2025 figure to compare against. Five are cheaper than they were a year ago.
Biggest increases:
| Area | Size tracked | Jul 2025 | Jul 2026 | Year over year |
|---|---|---|---|---|
| Chestnut Hill | 2 bedroom | $2,595 | $3,000 | up 15.6% |
| West Roxbury | 2 bedroom | $2,675 | $2,850 | up 6.5% |
| Beacon Hill | 1 bedroom | $2,700 | $2,870 | up 6.3% |
| Roxbury | 1 bedroom | $2,400 | $2,550 | up 6.3% |
| Cambridge | 1 bedroom | $2,750 | $2,900 | up 5.5% |
And the five that fell:
| Area | Size tracked | Jul 2025 | Jul 2026 | Year over year |
|---|---|---|---|---|
| South End | 1 bedroom | $3,175 | $3,025 | down 4.7% |
| Seaport District | 1 bedroom | $3,410 | $3,373 | down 1.1% |
| Roslindale | 2 bedroom | $2,875 | $2,850 | down 0.9% |
| Allston | 1 bedroom | $2,395 | $2,380 | down 0.6% |
| North End | 1 bedroom | $3,015 | $3,013 | down 0.1% |
South End is the one genuinely worth noticing. A 4.7% drop on a one bedroom is about $150 a month, or $1,800 over a year long lease, in one of Boston's more expensive neighborhoods.
One caution on Chestnut Hill. We publish only a two bedroom figure there, and a 15.6% swing on a single bedroom size in a small area is more likely to reflect which apartments happened to list than a real market move. Treat it as a flag to look closer, not as a finding.
The Agent-Stated No-Fee Rate
This is a number nobody else publishes, so it needs its name explained before its value.
The Agent-Stated No-Fee Rate is the share of Spot Easy listings that carry no broker fee, counted only among listings where the agent actually filled in the fee field.
In July 2026, the Greater Boston Agent-Stated No-Fee Rate was 79.4%. That is measured across the 40.2% of active listings that stated a fee at all.
The name is deliberately long because the denominator is the whole story. Roughly six in ten active listings say nothing about a fee, mostly because listings imported from third party feeds almost never populate that field. So this figure describes listings where an agent told us, and agents who use the no fee option skew toward having no fee inventory in the first place.
What it does not mean: it does not mean 79.4% of Boston apartments have no broker fee. We do not know that number. Neither does anyone else, and you should be suspicious of anyone who quotes one.
What it is genuinely good for is comparing areas within the same measurement, and watching it move month to month.
| Area | Agent-Stated No-Fee Rate | Share of listings stating a fee |
|---|---|---|
| Oak Square | 91.0% | 95.7% |
| Boston Downtown | 90.2% | 51.3% |
| Brighton | 88.7% | 60.0% |
| Allston | 87.6% | 56.0% |
| Jamaica Plain | 87.1% | 27.8% |
| South Boston | 82.9% | 25.5% |
| Boston | 81.3% | 45.3% |
| Fenway | 80.1% | 44.3% |
| Beacon Hill | 78.5% | 46.8% |
| Cambridge | 76.7% | 28.1% |
| Somerville | 75.3% | 32.6% |
| Back Bay | 72.7% | 46.4% |
| Brookline | 72.5% | 34.8% |
| South End | 70.4% | 23.2% |
| Mission Hill | 65.1% | 57.1% |
| East Boston | 49.2% | 42.3% |
Read the second column alongside the first, always. Oak Square's 91.0% comes from a sample where almost every listing stated a fee. Jamaica Plain's 87.1% comes from a sample where fewer than three in ten did, so it is a thinner signal about a narrower slice.
For what the law actually requires since August 2025, our Boston broker fee law guide covers who pays and when.
What a triple decker costs against a condo
Same city, same bedroom count, different building. Boston's housing stock is old and varied enough that the type of building you rent in moves your rent as much as picking a different neighborhood.
| Building type | Studio | 1 bed | 2 bed | 3 bed | 4+ bed |
|---|---|---|---|---|---|
| Multi-family | $2,100 | $2,500 | $3,050 | $3,600 | $5,200 |
| Apartment building | $2,225 | $2,670 | $3,200 | $3,775 | $4,795 |
| Brownstone | $2,300 | $2,800 | $3,525 | $4,750 | $6,150 |
| Condo | $2,500 | $3,000 | $3,650 | $4,200 | $5,200 |
A one bedroom in a multi-family, which in Boston usually means a triple decker, ran $2,500 in July. The same one bedroom in a condo ran $3,000. That is $500 a month, or $6,000 a year, for the same number of bedrooms.
Multi-family is the cheapest option at every bedroom count from studio through three bedrooms. If your search is driven by budget more than finish, filtering for triple deckers is the single largest lever in this dataset.
When is rent cheapest in Boston?
We can only partly answer this, and we would rather say so than repeat the usual claim.
Our monthly series starts in June 2025, so we have watched exactly one Boston autumn. In that one year, the one bedroom median dipped $5 in October 2025 and then rose $105 in November. That is the opposite of the "November is the cheapest month" advice you will find repeated across the web, usually with no source attached.
One autumn is not a seasonal pattern, so we are not going to claim the reverse either. What we will say is that we have not yet observed a winter discount in our own data, and we will publish what the next one looks like when we have measured it.
What our data does show clearly is the step pattern described above. Rent holds still for months, then resets. Both resets we have recorded landed in November and June, near lease turnover. If you can time a search, searching just before a reset beats searching just after one.
How we measure this
Every figure here comes from apartments listed on Spot Easy, not from a model or a survey.
- What counts: any listing on the market at some point during July 2026, in Greater Boston. That is Boston, Brookline, Cambridge, Somerville, Medford, Newton, Everett, Quincy, Watertown and Malden.
- Every qualifying listing on Spot Easy, not a sample or a model. We do not survey, estimate or extrapolate. If it was listed and it met the rules below, it is in the figure.
- Every listing traces to a licensed professional or the MLS. Agents are verified before their listings go live. There is no anonymous submission path into this dataset.
- The 20 listing floor. We publish a median for an area and bedroom size only when at least 20 listings qualify. Under that, we publish nothing.
- Duplicates removed. The same unit relisted is counted once.
- Rents outside $500 to $20,000 are excluded as data entry errors.
- Medians, not averages, so a few luxury units cannot skew a neighborhood.
The honest limits. This measures Spot Easy's inventory, not every apartment in Boston. It reflects asking rents, not signed rents. And because we recompute each month against live listing data, a figure can shift slightly if we republish, which is why we date everything by month rather than by day.
The underlying data is free to reuse with attribution under CC BY 4.0. Journalists and researchers can take the full Rent Index including the downloadable CSV. For questions about methodology, contact Joel Mundele, CEO, at [email protected].
Frequently asked questions
Is rent going up in Boston? Not in July 2026. Greater Boston's median one bedroom rent held at $2,750, unchanged from June, and four of five bedroom sizes moved by $5 or less. Over the full year since July 2025 the one bedroom median is up 5.8%, but that increase arrived in two steps rather than steadily, and five of the 24 areas we track are cheaper than they were a year ago.
What is the median rent in Greater Boston right now? As of July 2026: studio $2,295, one bedroom $2,750, two bedroom $3,395, three bedroom $3,900, four or more bedrooms $5,000.
Which Boston neighborhood has the cheapest rent? Among the areas where we publish a one bedroom figure, Allston was lowest in July 2026 at $2,380, followed by Brighton at $2,400 and Jamaica Plain and Dorchester at $2,500. Jamaica Plain had the cheapest studio at $1,950.
Which Boston neighborhoods got cheaper this year? Five: South End (down 4.7%), Seaport District (down 1.1%), Roslindale (down 0.9%), Allston (down 0.6%) and North End (down 0.1%), comparing July 2026 with July 2025.
What is the Agent-Stated No-Fee Rate? The share of Spot Easy listings carrying no broker fee, counted only among listings where the agent filled in the fee field. In July 2026 it was 79.4% across Greater Boston, measured over the 40.2% of active listings that stated a fee.
Do most Boston apartments have no broker fee? We cannot tell you that, and we will not pretend otherwise. Our Agent-Stated No-Fee Rate only covers listings where an agent stated a fee, which is about four in ten, and those listings are not a random slice of the market. Any source quoting a market wide no fee percentage for Boston is extrapolating from a partial sample.
Where does this data come from? Apartments listed on Spot Easy during the reported month, aggregated into the Rent Index and updated monthly. Full methodology and a downloadable CSV are at spoteasy.com/data/rent-index, published under CC BY 4.0.
Looking for a place now? Browse current Boston apartments on Spot Easy, or start with the neighborhood pages for Allston and Brighton, the two cheapest one bedroom markets in this month's index.
Rent figures as of July 2026. Updated monthly.